Dashboard
Analyzed large-scale media data is transformed into intuitive visual information through the dashboard, helping users understand key indicators from multiple angles at a glance, including buzz-volume trends, major keyword extraction, and media and reporter lists.
Every analytical indicator on the dashboard can be configured to include only the desired data through options such as channel, period, and classification keywords, enabling precise and efficient data exploration and insight generation.
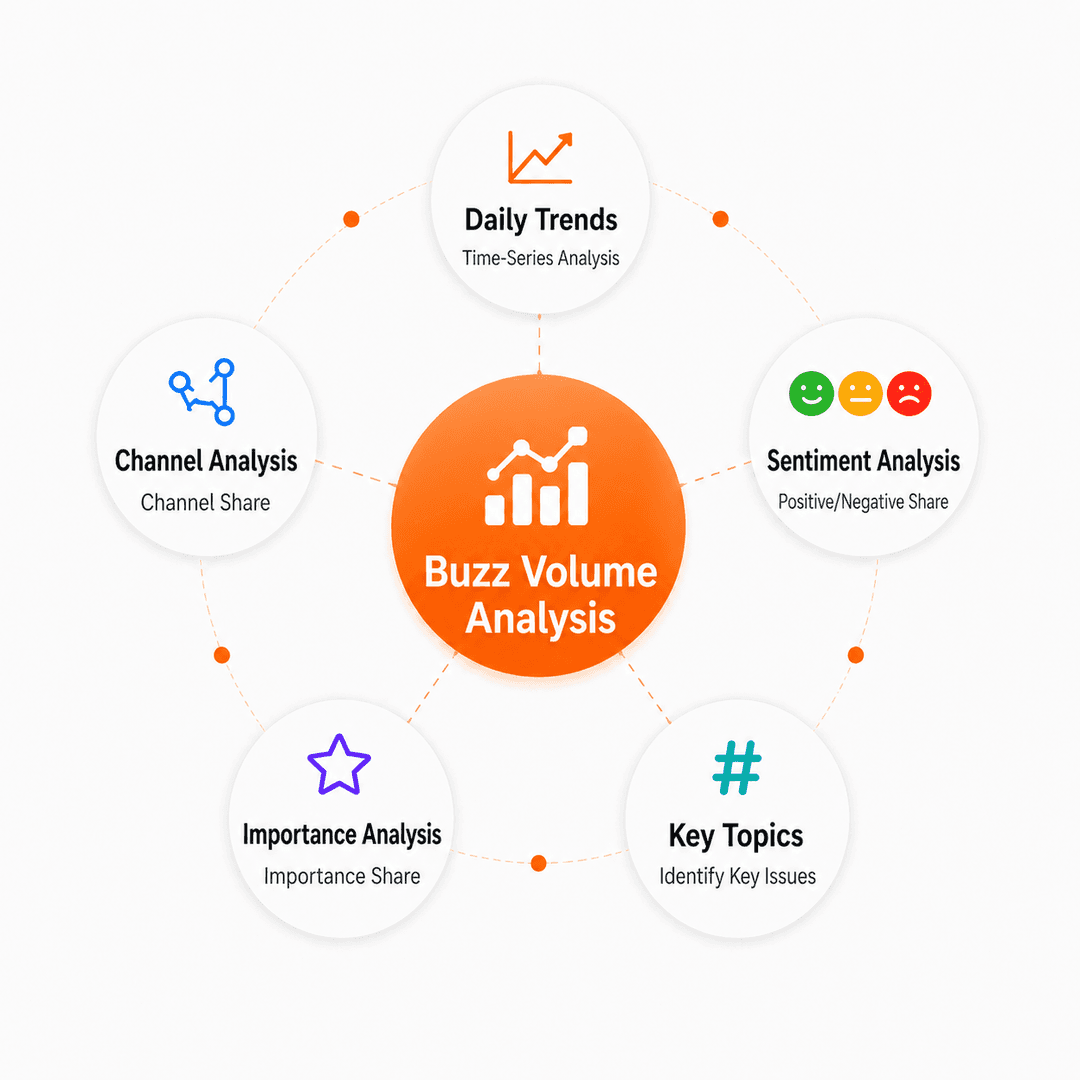
Buzz Volume Analysis
The spread of collected media data is analyzed through time-series and multi-angle indicators. Daily buzz-volume trends as well as channel, sentiment, and importance shares are visualized in intuitive graphs so the nature of public opinion can be understood at a glance.
AI-classified major topics also make it possible to identify immediately which core issues are concentrating buzz volume, while flexible options help teams trace meaningful signals within specific channels or sentiment states.
Keyword Analysis
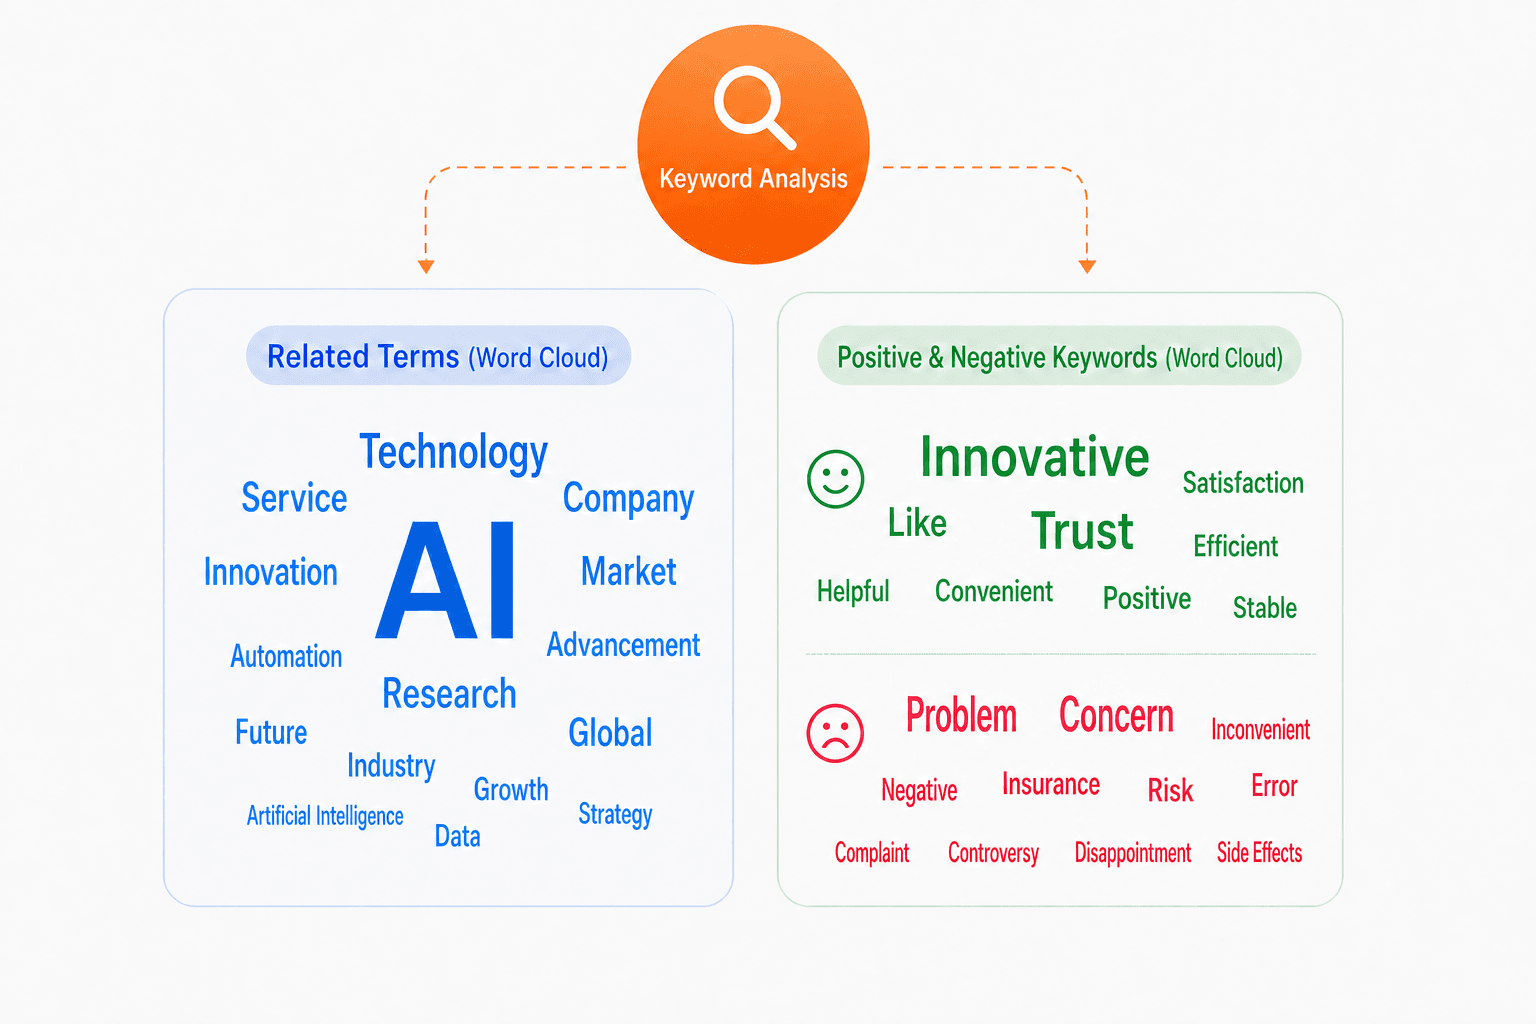
Media data within the specified analysis options is examined in depth to extract high-frequency core keywords along with positive and negative sentiment keywords, then visualize them through intuitive indicators.
Related content and article lists are matched in real time so the context behind each keyword can be understood immediately, enabling broader business insight into not only the numbers themselves but also the causes and trends of public opinion.
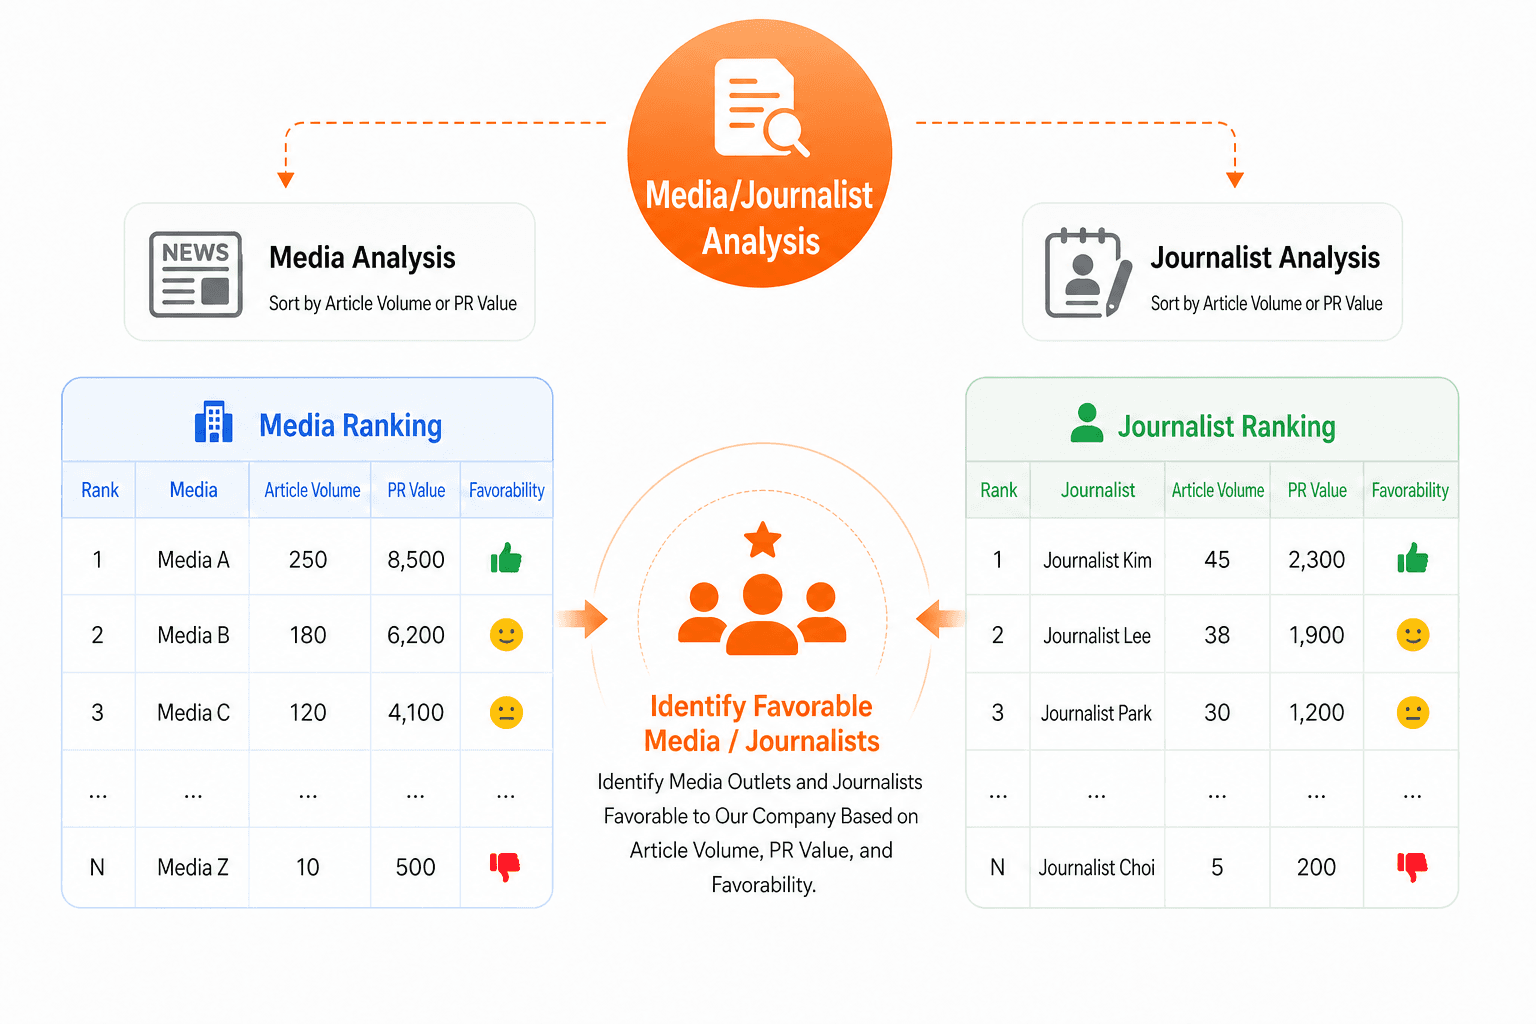
Media / Reporter Analysis
Using news-media data, the system visualizes key metrics such as article output, article value converted into PR value, and efficiency by outlet and reporter.
It helps identify and manage the media outlets and reporters most favorable to your company through objective data, supporting more strategic media relations and more systematic, proactive response to media risk.